
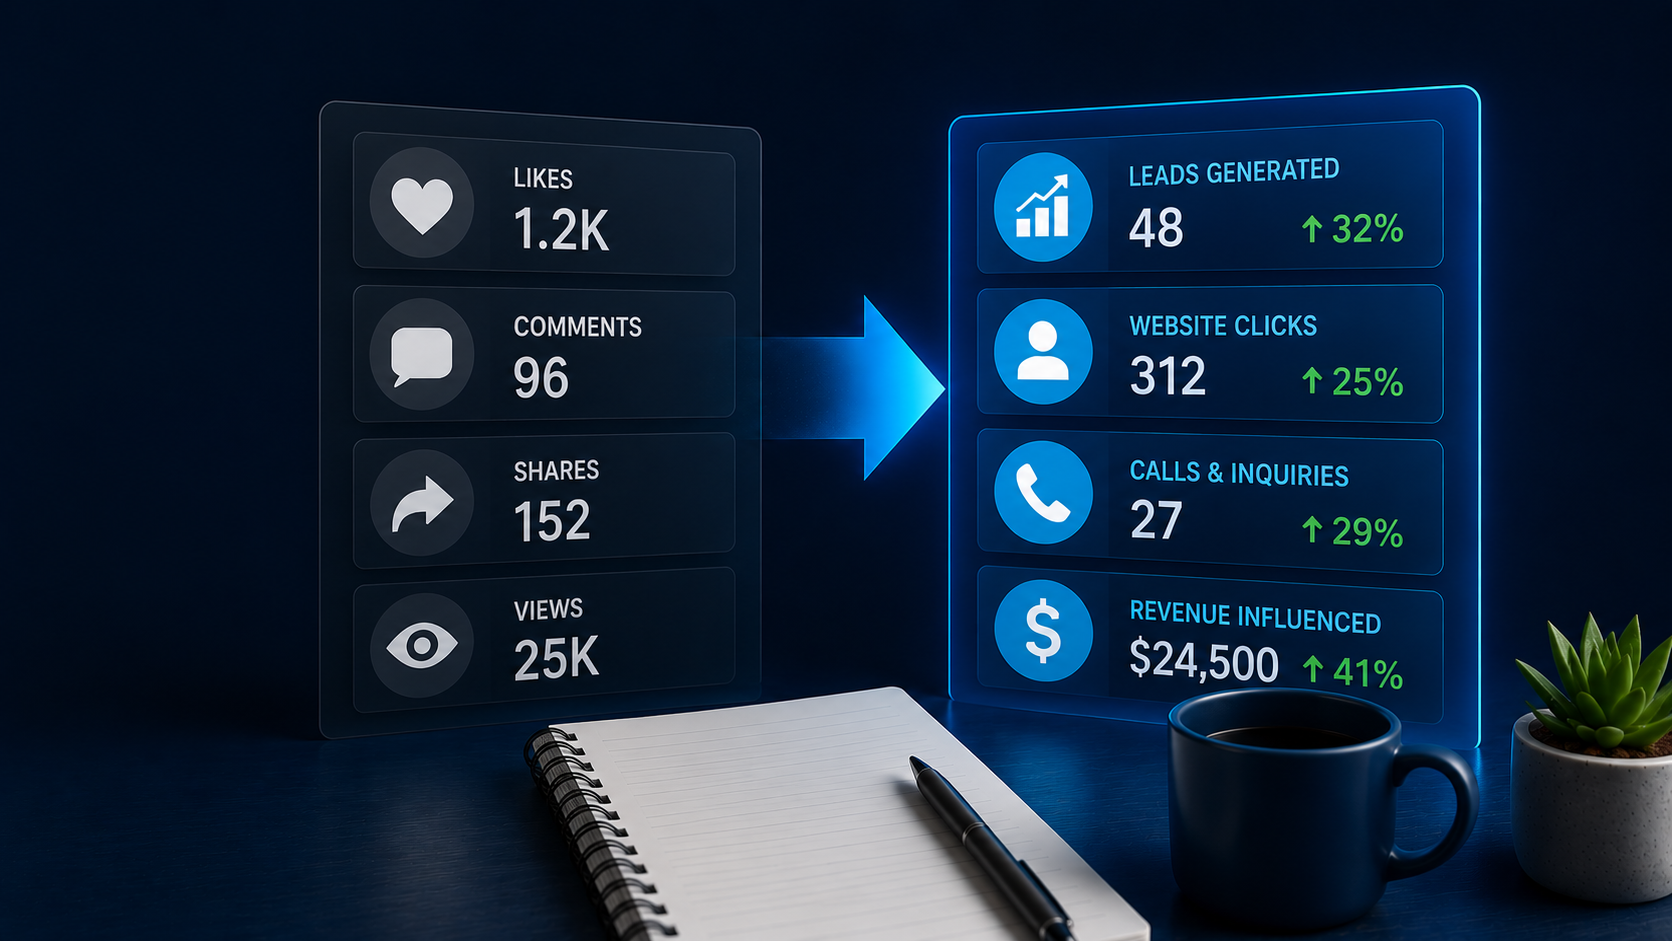
An HVAC company in my area just hit 50,000 impressions on a Facebook campaign. Their account manager sent a congratulations email. The owner called me the next day asking why his phone hadn’t rung once. He’d spent $1,200 that month.
Engagement metrics make clients feel like something’s happening. But most local businesses don’t get paid in impressions. They get paid when someone books an appointment, walks through the door, or picks up the phone.
The gap between what gets reported and what actually drives revenue is where trust erodes and budgets get cut.
The Vanity Metric Trap: Why Engagement Numbers Feel Good But Pay Nothing
Engagement metrics exist because they’re easy to generate and easy to report. A post gets 200 likes, and suddenly there’s a number to put in a monthly recap.
The problem is that those 200 likes might come from people three states over who will never become customers. A bakery in Portland doesn’t benefit from engagement in Phoenix. A plumber in Des Moines doesn’t get paid when someone in Denver shares their post.
Yet standard social media reports treat all engagement as equal, regardless of whether it came from the service area or from someone’s aunt in another time zone.
The real issue is conversion distance. A like requires one second of attention. A phone call requires intent, time, and readiness to spend money. Reporting the first without tracking the second is like celebrating how many people walked past your store without counting how many came inside.
What Actually Drives Revenue: The Three Metrics That Matter
Local clients need to see three things: qualified leads, cost per lead, and conversion rate. Everything else is context.
A qualified lead is someone who took an action that indicates buying intent within your service area. They filled out a contact form, called the business number, or requested a quote. These actions have friction, which filters out casual scrollers and leaves people who actually need what you’re selling.
Cost per lead tells you what you’re paying for that intent. If you spent $800 and generated 16 qualified leads, you paid $50 per lead. That number only matters in relation to what a customer is worth, but it’s the starting point for every budget conversation.
Conversion rate is where most local businesses lose the thread. You can generate 50 leads at $20 each, but if your sales process only closes 10% of them, you’re paying $200 per customer. If a competitor generates 20 leads at $40 each but closes 40%, they’re paying $100 per customer and winning. Tracking this requires connecting marketing data to what happens after the lead comes in.
Why Standard Reports Hide the Real Story
Most marketing platforms default to metrics that make the platform look good. Google Ads will highlight clicks. Facebook will emphasize reach. Email tools will celebrate open rates.
None of these platforms have an incentive to show you that their traffic didn’t convert.
A local law firm ran Google Ads for six months with a click-through rate the agency called “above average.” When we pulled the actual lead data, 80% of clicks came from people searching for free legal advice or looking for lawyers in other cities. The firm had been paying for traffic that was never going to convert because the agency optimized for clicks, not for qualified local leads.
The fix required adding negative keywords, tightening geographic targeting, and changing the landing page to qualify visitors before they clicked to call. Clicks dropped by 60%. Qualified leads doubled. Cost per case dropped by half.
The standard report would have shown the campaign getting worse. The revenue report showed it finally working.
Building a Dashboard That Actually Informs Decisions
Local clients don’t need 12-page reports. They need a single page that shows what came in, what it cost, and what happened next.
Start with lead source. Break down where each qualified lead originated: organic search, paid search, social media, referral, direct. This tells you where to double down and where to cut.
If organic search generates 40% of your leads at zero marginal cost, that’s where content investment pays off. If paid social generates 5% at high cost per lead, that budget might be better spent elsewhere.
Then show lead quality by source. Not all leads are equal. A contact form that says “interested in learning more” is weaker than a phone call asking for a quote.
Track which sources generate leads that actually turn into customers. One roofing company found that Facebook leads had a 12% close rate while Google Ads leads closed at 35%. Same cost per lead, wildly different cost per customer.
Finally, connect it to revenue. If you closed 8 customers last month at an average sale of $3,000, you generated $24,000. If you spent $2,000 on marketing, your return is 12:1. That’s the number that determines whether the budget goes up, stays flat, or gets cut.
The Conversation That Changes Everything
The shift happens when you stop reporting what happened and start showing what it means.
A client doesn’t need to know that impressions increased 23% month-over-month. They need to know that they got 14 qualified leads at $71 each, 6 of them booked appointments, and 4 of them signed contracts worth $11,000.
That’s the report that earns trust and renews contracts.
Dave Evers is Director of Digital Content at CGI Digital in Rochester, N.Y.